5 Lessons on Teaching in the Age of AI
When I joined Opportunities for a Better Tomorrow (OBT) as a digital marketing instructor in Brooklyn as a digital-marketing instructor, I didn’t expect to become part teacher, part designer, and part data analyst. But that’s what teaching in the age of AI looks like—blending human intuition, creative design, and real-time analytics.
I built the Individual Classroom Health Score (I.C.H.S.) so students could track their growth the way marketers track campaign performance. What began as a spreadsheet evolved into a Canva-based dashboard—the heartbeat of how we learn at OBT.
1. The I.C.H.S. Is Not a Grade—It’s a Digital Report Card for Growth
Traditional report cards summarize performance; the I.C.H.S. visualizes behavior. It’s not about GPA—it’s about learning analytics.
You can have a high I.C.H.S. and still struggle on a test, or ace every quiz and sit in the middle.
That’s because it measures the work of showing up: completing certifications, meeting deadlines, collaborating, communicating, and following through.
In marketing terms, if a report card is a final campaign report, the I.C.H.S. is the real-time dashboard showing how we got there.
Research backs it up: Visual progress tracking increases persistence by more than 30% (APA, 2024).
When students can see their trajectory—like analytics in TikTok or Google Ads—they naturally self-correct.
Their dopamine reward system fires not when they get a grade, but when they improve a number they understand.
2. Gen Z Learners Are Already Data Natives
My students refresh TikTok analytics more than traditional report cards.
They already understand engagement rates, watch time, and audience retention.
So I stopped fighting digital distraction and started harnessing it.
When academic performance became data they could visualize and analyze, school started to feel like the rest of their digital world—interactive, instant, and personalized.
That’s when accountability turned into ownership.
Students began to treat learning like content creation: testing, tweaking, and iterating.
3. From Grades to Insights: How the Dashboard Goes Deeper
A digital report card ends with a number.
The I.C.H.S. starts with one—and then asks why.
The dashboard lets me drill down to see patterns across assignments, attendance, and projects.
Using simple AI-assisted analytics, I can identify:
Common errors students make on quizzes or client projects.
Skill areas multiple students struggle with simultaneously.
Trends over time, like weeks where focus dips or participation spikes.
That turns teaching into data-driven coaching.
Instead of grading the past, we’re analyzing the present and shaping the next step.
The same tools marketers use to test campaigns—trend analysis, heatmaps, audience segmentation—can identify how students learn best.
It’s the new form of formative assessment.
4. Feedback Flows Both Ways
Once a week, we meet to review the data—and the conversation starts with their feedback on me.
They tell me what worked, what didn’t, what they’d change next week.
Then we analyze their scores together.
It’s not about authority; it’s about shared ownership.
That cycle builds psychological safety—the same principle used by creative agencies and startups to drive performance through transparency and collaboration.
5. AI Expands the Human Side of Teaching
When I first started at OBT, I had two weeks to build everything: the course, the dashboard, the analytics system.
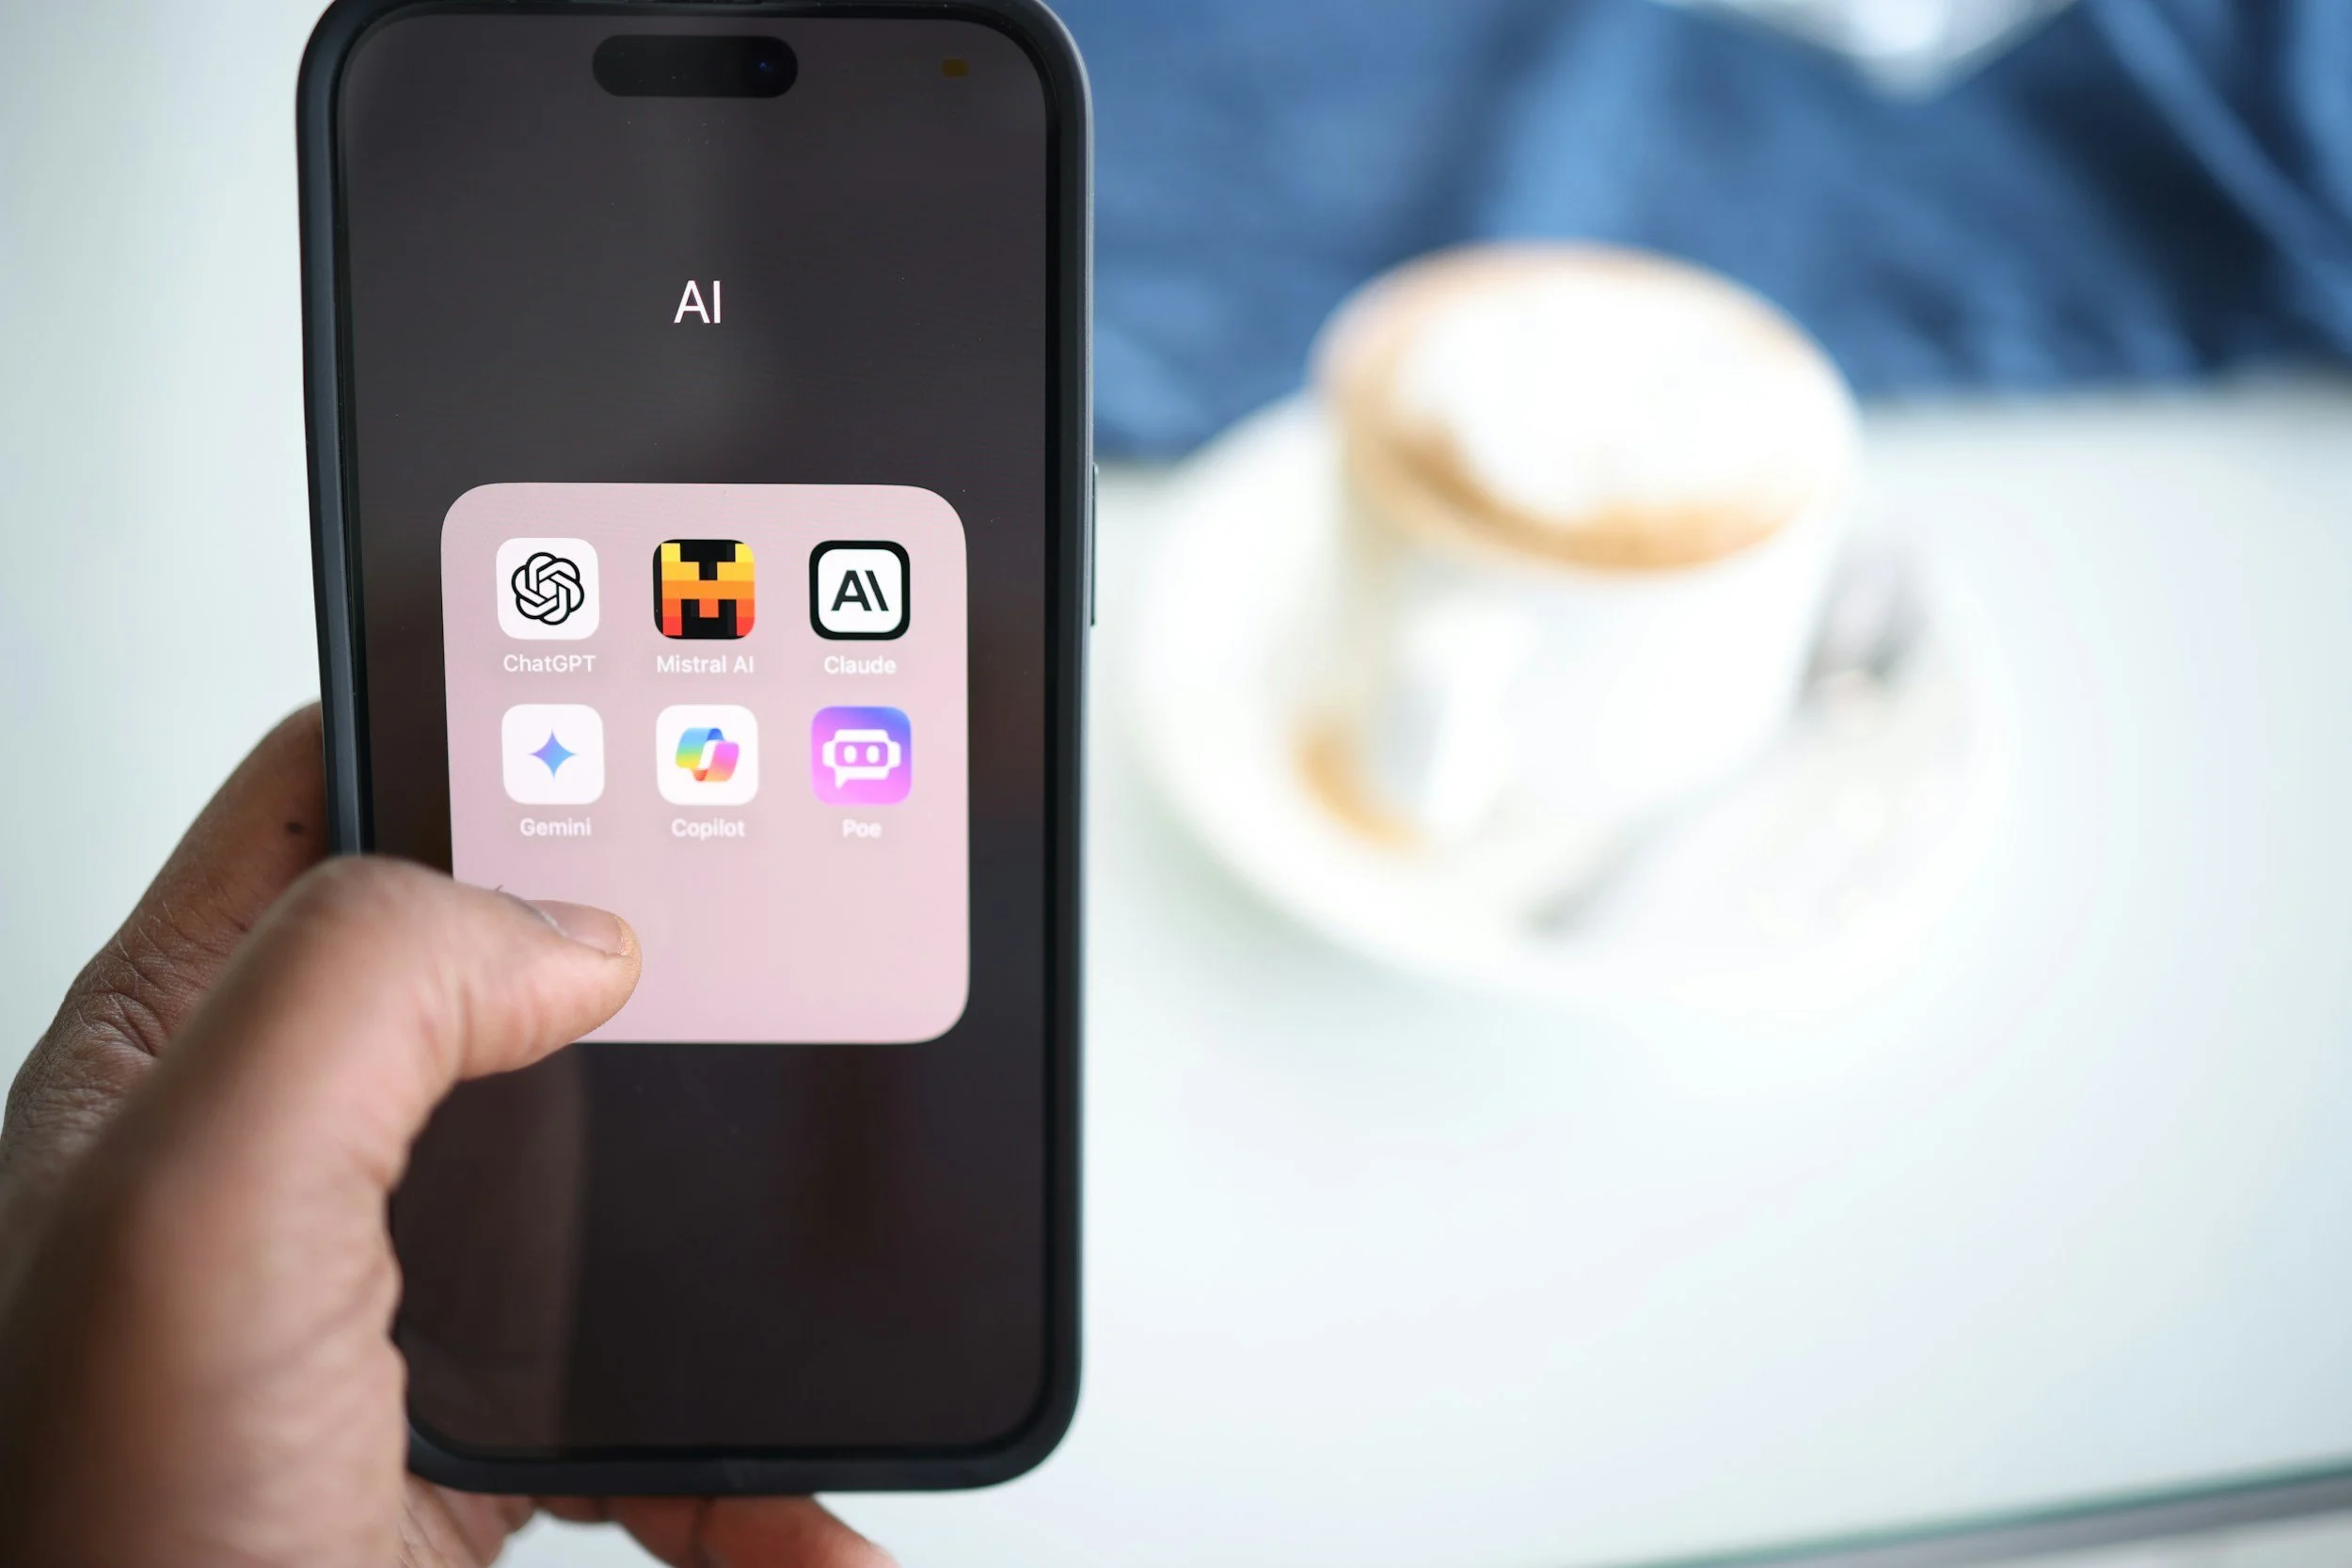
ChatGPT Plus became my silent partner.
I used it to plan lessons, design templates, and build data frameworks that let me focus on teaching, not formatting.
AI didn’t replace me—it multiplied my reach.
It handled the structure so I could amplify empathy.
Now, AI even helps me analyze open-ended responses and identify learning patterns I might miss on my own.
Why This Works Beyond OBT
The I.C.H.S. model can fit any subject—math, culinary arts, healthcare—because it measures how students work, not just what they know.
It tracks consistency, communication, creativity, and problem-solving.
Results from my pilot at Opportunities for a Better Tomorrow:
93% of students checked their dashboards weekly.
28% increase in on-time submissions.
Every student could name at least one personal growth metric by week 4.
That’s not higher grades—it’s higher awareness.
The next step is collaboration. I’m building an open-source framework that teachers anywhere can customize with tools like Canva, Google Sheets, or their LMS.
We’re testing integrations that let AI flag trends—like recurring wrong answers on tests or drop-offs in participation—so educators can intervene early, not after the final exam.
The vision is simple:
Every classroom becomes a dashboard. Every student becomes a data story.
Join the Conversation
What if classrooms worked the way digital platforms do—transparent, adaptive, and designed to help everyone grow in real time?
How could we make feedback feel more like collaboration and less like correction?In marketing, we measure engagement. In education, we build it. The dashboard doesn’t replace teaching—it simply gives learning a language the next generation already speaks.
Let’s Connect Interested in building a data-driven classroom or inviting me to speak with your educators? Fill out the form below—I’d love to collaborate or share templates from the I.C.H.S. system.
Closing Thought
In marketing, we measure engagement.
In education, we build it.
The dashboard doesn’t replace teaching—it simply gives learning a language the next generation already


